But I got to thinking that there ought to be some other ways of socializing this content and making it stick with visitors or our customers. Wouldn't it be terrific if they could be reminded easily what our position is on this subject while consuming and interacting with analytics and visualization content we have developed for them. Here is where Tableau is quite useful.
At the recent Tableau European Customers Conference, there was discussion in the twitter stream (https://twitter.com/#!/search/realtime/%23tcceu12) about embedding web content inside Tableau deliverables. The specific question had to do with embedding Tableau views and workbooks into PowerPoint presos, and the other way around -- embedded PowerPoint presos into Tableau workbooks. Secondarily, what about other content, like web sites, .pdf documents, etc. All this is quite simple with Tableau using URL actions. Their knowledge base elucidates these examples: Linking to External Files. and Embedding Live Tableau Server Views into PowerPoint. With this guidance, embedding the SlideShare presentation in a Tableau workbook we have developed for a client should be a no-brainer.
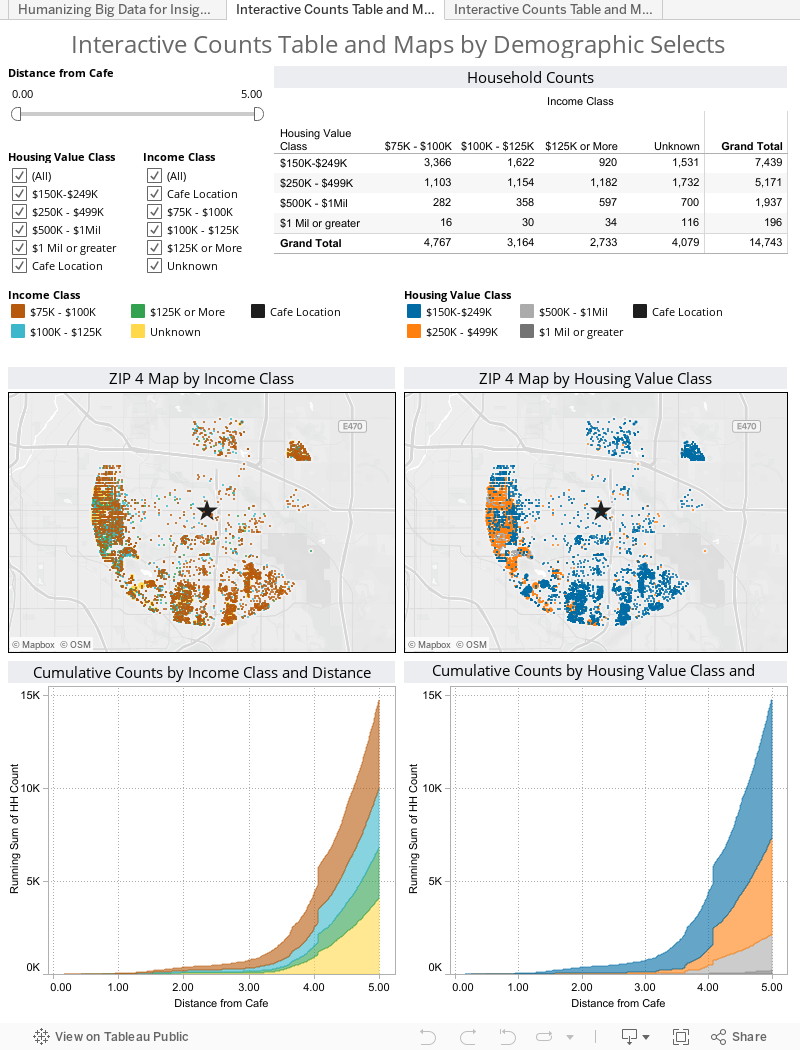
And, it is. In the Tableau workbook below, our client wanted to see the location and number of direct mail prospects that might be available for a new store opening, and they wanted to interactively modify the criteria for the household demographics and distance from the proposed store. While we were at it, we took the opportunity to embed the SlideShare preso into the workbook, and delivered the whole thing via Tableau Public, since there was no proprietary data in the workbook. The views in this embedded workbook are accessible using the tabs at the top. If you click on the tab titled "Humanizing Big Data for Insights and Actions", you should see the same SlideShare presentation. This could very easily be a results presentation, or a video explaining how to use the rest of the workbook, or the latest Flickr photostream from the trip to grandma's house.