The Challenge
During a challenge developing TOCs and navigational controls for a use case in my day job, I wondered if it would be possible to use a separate data source for the TOC that had no direct relationship to the the primary and any secondary data that underlies a visualization. One thing that makes this idea attractive is that the data source sits alone. No calculated fields in a primary or secondary source. So, colleagues who have access to the underlying data won't have reason to ask, and I won't have to answer, this question, "What is that "Go to xxxx" column in the data, and why is it populated for every record?"
Requirements
- Make the TOC data source independent of any primary or secondary data sources.
- Make the contents of the TOC labels easy to manage and change.
- Allow the data source for the TOC to support TOC navigational controls.
- Provide a way to incorporate standard tool tips or flexible ones, depending on the use case. This includes the ability to insert data from a view or dashboard into the tool tips.
The first step is building a framework for the database. In this example, I was in a hurry, so I just made up a little .txt file that looks like this:

This works perfectly fine with a table you can put together with your favorite data source type (Excel, Access, SQL based table, etc.)
The item field will be used to filter the text label of the TOC entry.
The text field is the actual text label that is displayed in the TOC entry. Note that the text for item 7 is "View ToC".
The tooltip field is an optional field that holds any predetemined instructional text associated with a TOC entry.
The optional type field identifies what kind of use the record is intended to fill.
The example listing is just that, an example. This data source can have as few or as many records as necessary. Obviously, it can change on the fly, as well, as more TOC entries or instructional tool tips are required.
The second step is to connect to this data in Tableau using the appropriate connector. In order to make this Tableau data source available to others and facilitate it's standardization, I extracted it.
The third step is to make the individual TOC entries. Follow this process:
- Select this data connection, then start a new worksheet(Ctrl+M).
- The item' field in the data source is a record id. To see how the ids relate to the TOC text, drag item, text, and type to the Row shelf to make a reference table.
- Start another new worksheet. Drag the item dimension to the Filter shelf, and select just one of the values, for example, 2.

- Drag the 'text' dimension to the Text shelf.
- To help with formatting, I added a calculated dimension named 'header', and set its literal value to ''.
- Drag the 'header' dimension to the Row and Column shelves. Right click on one of these and uncheck Show Header.

- Choose Format | Borders from Tableau's menu, then set Row and Column Dividers as desired.
- Chose Format | Shading, then set the Default Worksheet shading as desired.
- Choose Format | Font, then set the Default Worksheet font as desired.
- Duplicate the worksheet to preserve this formatting.
- On this duplicated worksheet, edit the item dimension filter on the Filter shelf by selecting another single one of the values. This will change the text displayed in the new worksheet.
- Repeat step 10 and 11 in this list as necessary. Be sure to include a worksheet that filters to the View ToC item, in this case, filter item to 7.


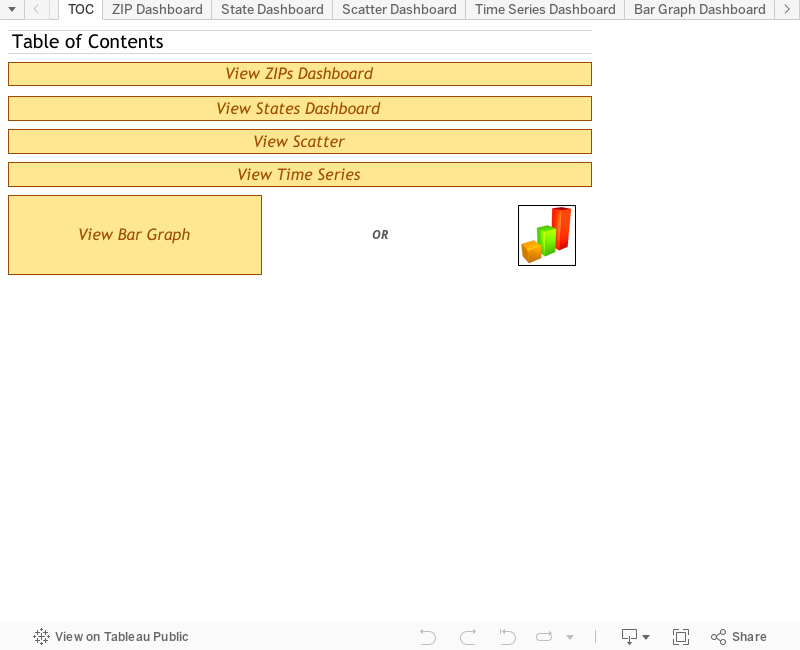
- Make a new dashboard and set the height large enough to hold all the TOC entries. Give the dashboard a name, like "Table of Contents" or "Navigation Menu"
- Add a vertical layout container to the dashboard.
- Add the individual TOC entry worksheets to the vertical layout container in the order needed. See if you can spot the joke in the dashboard image below.
- Add filter actions to the dashboard that target the dashboards or worksheets of interest. For each action, be sure to clear the check boxes for the component sheets on any target dashboard. Also, set the target filters to Selected Fields, but add no filters.
- Set Run action on to Select.


The fifth step is to add the View ToC worksheet to any dashboard that requires a one click return to the Tableau of Contents dashboard itself. Each of the sample dashboards in the embedded workbook have this sheet included. Here is an example:

Since each TOC entry is a worksheet of its own, each can have its own tool tip if necessary. One way to facilitate this is to include the text of any tool tip in the TOC data source. In this example data source, the field. 'tooltip" serves this purpose. For example, here is the data source that drives the TOC content. Note that the 'tooltip' field has the value 'Go to Bar Graph Dashboard'.

The Tableau Public workbook has some other thoughts in it about how to use this independent data source idea.
Please offer your comments or suggestions for improvement.
P.S.
First I did some research, checking out a number of table of contents and navigational controls examples from Tableau Zen Masters Joe Mako, Steve Wexler, Craig Bloodworth, Andy Kriebel, Ryan Robataille, Kelly Martin, Jonathan Drummey, Ramon Martinez, Alan Smithee and others. The most common solution was one with which I was familiar -- usng calculated fields to hold text that could be used in conjunction with shape marks (arrows, custom shapes, etc.) to give instructions via tooltips, and fire filter actions to control navigation to dashboards and worksheets in various ways. This method is described in Tableau's Knowledgebase article, Creating a Table of Contents to Navigate to Other Dashboards. But this in not quite what I wanted. Then Matt Francis posted his very cool article titled Create a default TableauTemplate - now with added 8.1 goodness. Matt got me thinking about the possibility of adding a generic data source to the template that could serve as a framwork for doing TOCs, navigational controls, help buttons, and other things.
Hi,
ReplyDeleteThis is exactly what I've been looking for. However, does this only work for navigating from the a dashboard to another dashboard?
I downloaded your example and added a test worksheet with an existing item then added the filter. It does not navigate to it.
Thanks!
Deletenorton 2012 genuine key , windows 10 activation toolkit , cheap office 2016 series key , onenote 2007 activation , win 7 ultimate product key , windows 10 product key clean install , windows 7 ult keys retail , windows vista anytime upgrade keygen download , l3aY7G
buy office 2016 product key
windows server 2012 r2 free
rosetta stone french key sale
windows 10 product serial number offer
windows 7 product serial number
Marvelous, what a weblog it is! This webpage gives valuable information to us, keep it up...my website http://www.sqiar.com
ReplyDeleteHi,
ReplyDeleteThe clients can showcase their products and services by using such lists to reach out the Target Businesses or Consumers.
Business & Consumer Database
A premier database organization providing all types of Business & Consumer Database to reach out your target audience.
nice information .thank you for sharingTableau Online Training
ReplyDeleteThanks for your informative article.Its very useful to my visual analytics. Thanks for the making reusable tableau concepts. Tableau Training in chennai
ReplyDeleteThis comment has been removed by the author.
ReplyDelete
ReplyDeleteThis idea is a decent method to upgrade the knowledge.thanks for sharing
Tableau online training in Hyderabad
Tableau training in Hyderabad
online Tableau training in Hyderabad
Really it was an awesome article… very interesting to read…
ReplyDeleteThanks for sharing.........
Tableau online training in Hyderabad
Tableau training in Hyderabad
Best Tableau online training in Hyderabad
I regard your endeavors since it passes on the message of what you are trying to state. It's an exceptional dominance to make even the individual who doesn't consider the subject could arranged to comprehend the subject. Your web journals are sensible and in addition extravagantly depicted. I should need to investigate a reliably extending number of intriguing articles from your blog. Continue Sharing
ReplyDeleteTableau online training in Kolkata
Online Tableau training in Pune
This comment has been removed by the author.
ReplyDeleteThank you so much for your wonderful concept and truly well post. I appreciative to your sharing and i want more updates from your blog.
ReplyDeleteTableau Course in Bangalore
Tableau Certification in Bangalore
Tableau Training Institutes in Bangalore
Tableau Training in Bangalore
Tableau Classes in Bangalore
All are saying the same thing repeatedly, but in your blog I had a chance to get some useful and unique information, I love your writing style very much, I would like to suggest your blog in my dude circle, so keep on updates.
ReplyDeleteSelenium Training Institute in Chennai
Best selenium training in chennai
selenium course in coimbatore
selenium training
Selenium Course in Bangalore
Selenium Classes in Bangalore
Awesome article, it was exceptionally helpful! I simply began in this and I'm becoming more acquainted with it better! Cheers, keep doing awesome!
ReplyDeleteSoftware Testing Services
Independent Software Testing Services
Functional Testing Services
QA Automation Testing Services
eCommerce Testing Services
Performance Testing Services
Security Testing Services
API Testing Company
Regression Testing Services
Mobile App Testing Services
Good. I am really impressed with your writing talents and also with the layout on your weblog. Appreciate, Is this a paid subject matter or did you customize it yourself? Either way keep up the nice quality writing, it is rare to peer a nice weblog like this one nowadays. Thank you, check also virtual edge and best event planning books
ReplyDeleteI was looking for this certain information for a long time. Thank you and good luck.
ReplyDeletePTE institute in ambala
Study visa consultants in ambala,
Best IELTS Institute in Ambala
Best IELTS Coaching in Ambala
mmorpg oyunlar
ReplyDeleteinstagram takipçi satın al
tiktok jeton hilesi
TİKTOK JETON HİLESİ
Sac Ekim Antalya
ınstagram takipci satın al
İnstagram takipçi satın al
metin2 pvp serverlar
ınstagram takipçi satın al
TÜL PERDE MODELLERİ
ReplyDeletesms onay
mobil ödeme bozdurma
nft nasıl alınır
ankara evden eve nakliyat
Trafik Sigortası
Dedektor
web sitesi kurma
aşk kitapları
Smm panel
ReplyDeletesmm panel
iş ilanları
İnstagram Takipçi Satın Al
hirdavatciburada.com
beyazesyateknikservisi.com.tr
SERVİS
tiktok jeton hilesi
pendik daikin klima servisi
ReplyDeletetuzla toshiba klima servisi
tuzla beko klima servisi
çekmeköy daikin klima servisi
ataşehir daikin klima servisi
maltepe toshiba klima servisi
kadıköy toshiba klima servisi
üsküdar toshiba klima servisi
pendik lg klima servisi