Saturday, June 2, 2012, ESPN More Sports' Stats & Info site carried a special look at Johan Santana's history making no-hitter in a New York Mets - St Louis Cardinal's match-up. The story included a playing field visualization of each out in the game, using Tableau Public. The visualization places a circle at the location of each out. The circles are color-coded by type of play (fly out, ground out, strike out). The inning in which an out occurred is encoded by varying the size of the circle; all outs in inning one supposedly one size, inning two, slightly larger, and so on). Take a look at the image below:
Nice work, but I felt a need for more interaction. What if you want to see quickly all the outs in a particular inning - not easy or simple enough. The hold-over tool tip requires too much effort to decode. The color encoding in the original conforms to Tableau's automatic best practice, but a more color-blind friendly palette might be as effective. Finally, the size encoding is based on the use of a numeric measure for inning, 0.0 to 9.0, when really these are discrete values (more of a dimension/category).
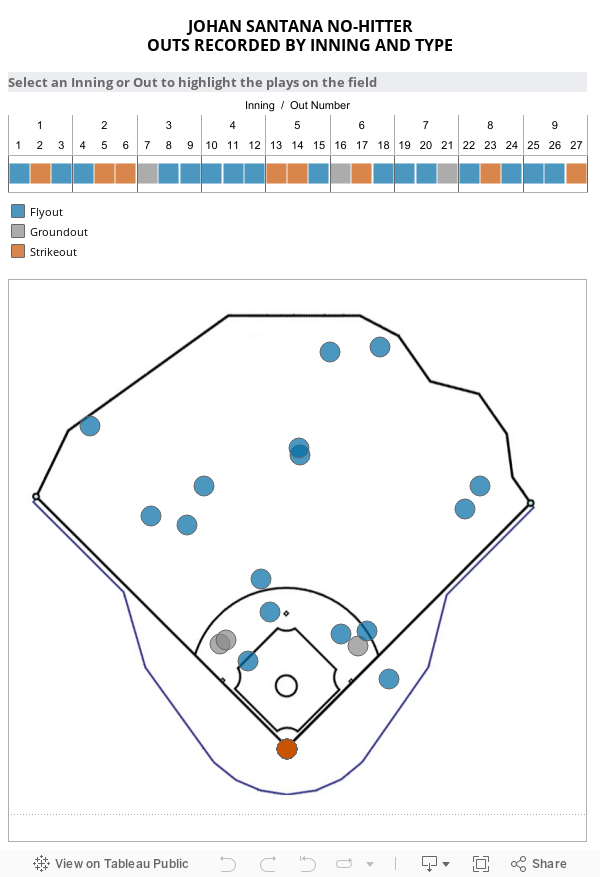
So, I did a rework, shown below. It includes a simple box score, so to speak, identifying each out in each inning, by type. Now the viewer can immediately see how the inning went for Santana, with almost no cognitive load. The box score has instructions telling the viewer to select an inning header to highlight all the inning's outs on the playing field viz. Better interaction. Also, you can select more than one inning, and compare them to one another. The size encoding on the field view is improved for the innings. Size is not really the best encoding here, because the larger circles might suggest "bigger" or "more" or "better", which is not the case here, but it works in a pinch.
When I showed this rework to the author, his comment was, "all we need now is an asterisk for the disputed foul-ball call at 3rd base in the 6th inning." So, back to the authoring board I went to take care of that. For the disputed call, a conditional text field makes a footnote appear in the tooltip when you hover over the box score or playing field marks for the groundout; it reminds that the previous pitch resulted in a hit that was called foul, but replay showed was fair. The footnote does not appear when you hover anywhere else. At the same time, I improved the tooltip, so that all the information one needed was in a simple color coded sentence, based on the play type. This kind of tooltip flexibility is very easy to do in Tableau and is widely applicable.
And baseball fanatic colleague Matt Booher suggested adding links to video clips to the out-by-out strip at the top, for key plays. So, now, if you hover over game out #16 (6th inning out #1) or game out #22 (8th inning out #1), you will see links to the MLB video clips for these outs. A new browser window opens in each case.
Try out the viz below, and think of a "Yes, and ..." that might apply to your work and data.
Your version is so much better. I'm not a big fan of using the circle size to identify the inning and, really, it's not necessary given that you allow the user to click on an inning to highlight.
That'd be the only change I'd make.
I like the inning selector chart. Very well done and super simple and informative.
SQIAR (http://www.sqiar.com) is a leading Business Intelligence company and provides Tableau Software consultancy across United Kingdom,USA,Canada,Australia
Descriptive analyticsare the first step in any data analytics project. They allow you to see what the data looks like so you can determine what questions you need to ask. Descriptive analytics are simple analyses that give you a basic overview of the data.
This particular is usually apparently essential and moreover outstanding truth along with for sure fair-minded and moreover admittedly useful My business is looking to find in advance designed for this specific useful stuffs… Hitter box

Your version is so much better. I'm not a big fan of using the circle size to identify the inning and, really, it's not necessary given that you allow the user to click on an inning to highlight.
ReplyDeleteThat'd be the only change I'd make.
I like the inning selector chart. Very well done and super simple and informative.
Andy,
ReplyDeleteThanks so much for your comment. Point taken and change made. Also, check out the video links for 6th inning, out 1, and 8th inning, out 1.
SQIAR (http://www.sqiar.com) is a leading Business Intelligence company and provides Tableau Software consultancy across United Kingdom,USA,Canada,Australia
ReplyDeleteNice blog this is very useful thank you for sharing Tableau Online Training
ReplyDeleteDescriptive analyticsare the first step in any data analytics project. They allow you to see what the data looks like so you can determine what questions you need to ask. Descriptive analytics are simple analyses that give you a basic overview of the data.
ReplyDeleteThis particular is usually apparently essential and moreover outstanding truth along with for sure fair-minded and moreover admittedly useful My business is looking to find in advance designed for this specific useful stuffs… Hitter box
ReplyDelete